
UV-Visible Spectrophotometry
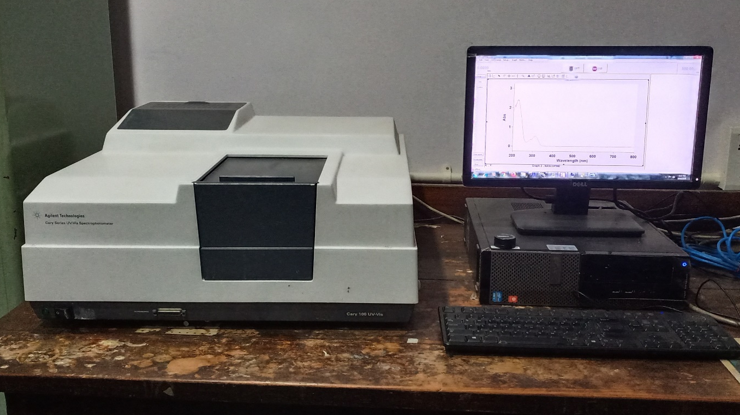
Ultraviolet-visible spectrophotometry is an absorption technique that measures the extent to which a molecule absorbs electromagnetic radiation in the wavelength range of approximately two hundred to eight hundred nanometres. Absorption in this region arises from electronic transitions within chromophoric groups such as conjugated double bonds, aromatic rings, and carbonyl functionalities. Because the relationship between absorbance and analyte concentration is described by the Beer-Lambert law, UV-Visible spectrophotometry provides a simple, rapid, and economical means of quantitative analysis and remains the most widely used technique for routine assay of active pharmaceutical ingredients possessing suitable chromophores.
UV-Visible spectrophotometry is extensively applied in pharmaceutical quality control for assay of bulk drugs and formulations, dissolution testing, and preliminary identification through characteristic absorption maxima. Its principal advantages include operational simplicity, low instrumentation cost, minimal sample preparation, and rapid analysis time, which make it particularly suitable for high-throughput quality control environments. Its principal limitation lies in its comparatively low selectivity, since it cannot readily distinguish between structurally related compounds possessing similar chromophores, which restricts its utility for impurity profiling in complex multi-component formulations unless combined with a prior separation step.
Method development in UV-Visible spectrophotometry begins with selection of an appropriate solvent system that fully dissolves the analyte without introducing spectral interference, followed by a wavelength scan to identify the wavelength of maximum absorbance, which is subsequently used as the analytical wavelength. A calibration curve is then constructed across an appropriate concentration range to confirm linearity, and the method is finalised through formal validation encompassing accuracy, precision, and range in accordance with regulatory expectations.
Objective
To develop a simple, accurate, precise, and reliable UV-Visible spectrophotometric method for the quantitative estimation of an analyte by optimizing solvent selection, analytical wavelength, calibration curve, sample analysis, and method validation according to regulatory guidelines.
Purpose
The first step in UV-Visible method development is selecting a suitable solvent that completely dissolves the analyte without interfering with UV absorption.
Principle
The solvent should provide complete solubility of the analyte and remain transparent at the selected analytical wavelength to avoid background interference.
Commonly Used Solvents
- Purified Water
- Methanol
- Ethanol
- Buffer Solutions
Selection Criteria
- Complete analyte solubility.
- Transparent in the UV region.
- No chemical interaction with the analyte.
- High purity (spectroscopic grade).
- Filter and degas if required.
Importance
- Ensures accurate absorbance measurement.
- Reduces background interference.
- Improves method sensitivity and reproducibility.
Purpose
To identify the wavelength of maximum absorbance (λmax) for the analyte.
Principle
The analyte solution is scanned over a specified wavelength range, and the wavelength showing the highest absorbance is selected as the analytical wavelength.
Typical Scan Range
- 200–400 nm
Procedure
- Prepare a suitable analyte solution.
- Scan the solution across the UV range.
- Record the absorption spectrum.
- Identify the wavelength with maximum absorbance (λmax).
Importance
- Provides maximum analytical sensitivity.
- Improves method accuracy.
- Enhances precision during quantitative analysis.
Purpose
To establish a relationship between analyte concentration and absorbance for quantitative estimation.
Principle
Standard solutions of different concentrations are prepared, and their absorbance is measured at λmax. A calibration curve is constructed by plotting absorbance against concentration.
Procedure
- Prepare 5–7 standard concentrations.
- Measure absorbance at λmax.
- Plot Absorbance vs. Concentration.
- Calculate the regression equation.
- Determine slope, intercept, and correlation coefficient (R²).
Acceptance Criteria
- Correlation Coefficient (R²) ≥ 0.999
Importance
- Enables accurate concentration determination.
- Demonstrates method linearity.
- Provides the regression equation for unknown sample analysis.
Purpose
To determine the concentration of unknown samples using the calibration curve.
Principle
The absorbance of the sample is measured at λmax and compared with the calibration curve to calculate the analyte concentration.
Procedure
- Prepare the sample solution.
- Use the selected solvent as the blank.
- Measure absorbance at λmax.
- Calculate concentration using the regression equation.
- Perform replicate measurements for reliability.
Importance
- Provides accurate quantitative analysis.
- Ensures reliable and reproducible results.
- Supports routine pharmaceutical quality control.
Purpose
To confirm that the developed method is suitable for its intended analytical application and complies with regulatory requirements.
Principle
The method is validated according to ICH guidelines by evaluating its performance characteristics.
Validation Parameters
Accuracy
- Evaluated by recovery studies.
- Acceptance: 98.0–102.0%
Precision
- Repeatability (%RSD ≤ 2.0%)
- Intermediate Precision (%RSD ≤ 2.0%)
Linearity and Range
- Demonstrates proportionality between concentration and absorbance.
- R² ≥ 0.999
Limit of Detection (LOD)
The lowest concentration that can be detected but not necessarily quantified.
Where:
- σ = Standard deviation of response
- S = Slope of calibration curve
Limit of Quantification (LOQ)
The lowest concentration that can be quantified with acceptable accuracy and precision.
Robustness
Assesses the effect of small deliberate changes in analytical conditions on method performance.
Importance
- Confirms method reliability.
- Ensures regulatory compliance.
- Demonstrates suitability for routine analysis.
Selection of the analytical wavelength must consider potential interference from excipients or degradation products absorbing in the same spectral region, and derivative spectrophotometry or dual-wavelength approaches are frequently employed to resolve such overlapping spectral contributions without resorting to a full chromatographic separation.
Contemporary applications of ultraviolet-visible spectroscopy extend beyond simple assay determination to include chemometric approaches such as partial least squares regression for simultaneous multi-component determination, and its integration with flow-injection and process analytical technology systems for real-time in-line monitoring of pharmaceutical manufacturing processes.